The debug information is a collection of helpful snippets of information that Portmaster produces itself. Often, you will be asked to collect this information while the reported issue is occurring. This is important, as the data is gathered live from the current state of Portmaster and will help us to see what the problem is.
If you’re experiencing a problem with a certain application, it can be very helpful to copy the application-specific version of the Debug Info. This is only (easily) possible using the “Application Page” method explained later.
We’ve taken care to include as little personal information as possible in the Debug Info. You can further reduce this information by restarting the Portmaster before copying the data - if you can reproduce the issue that way too. You are of course also free to delete parts of the data before submitting - in that case please mark the areas you have deleted with [DELETED], so we know that information is missing.
Here is also a guide on what is in the Debug Info and how you can read it yourself: How to interpret the Debug Info
There are multiple ways to acquire and share the Debug Info:
¶ Tools Menu
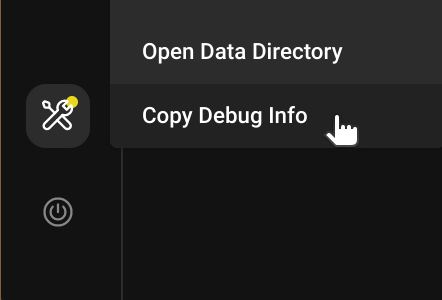
Just click on the “Copy Debug Info” button in the tools menu in the bottom left. This copies the Debug Info to your clipboard. You can paste this directly into a Github Issue - it is automatically formatted using sections. It looks ugly in text format, but if you click on the “Preview” tab of your comment, you will see it nicely rendered.

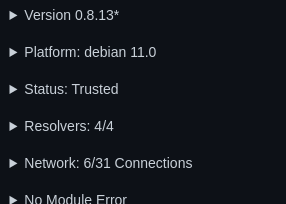
It renders to something like this on GitHub:

¶ Application Page
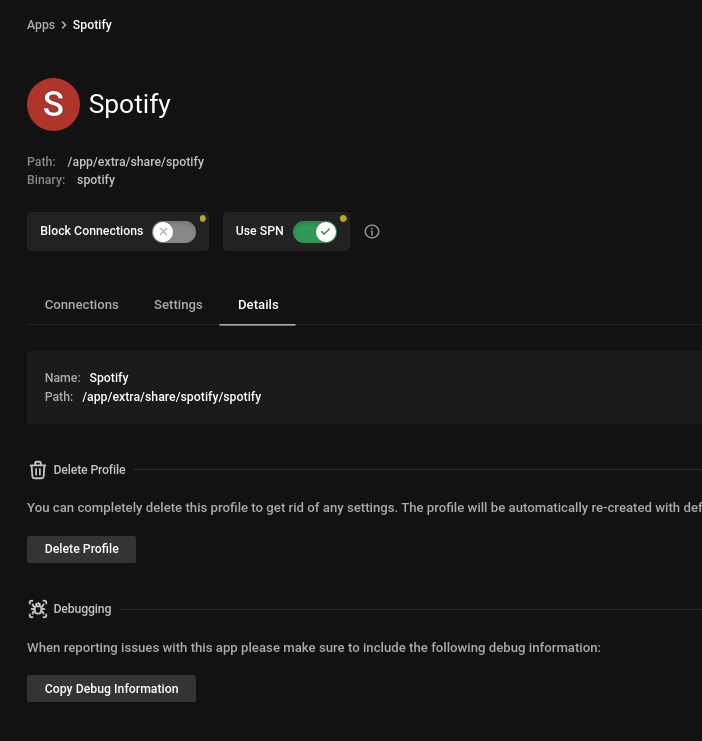
Find the affected application in the Portmaster App, then go to the “Details” tab and click on “Copy Debug Information” at the end of the page. This copies the Debug Info to your clipboard. You can paste this directly into a Github Issue - it is automatically formatted using section. It looks ugly in text format, but if you click on the “Preview” tab of your comment, you will see it nicely rendered.

¶ Privately Via Ticket
Alternatively, you can submit the Debug Info privately via a support ticket. To do this:
- Open the Portmaster App
- Go to the Get Support page using the question mark button on the navigation bar on the left
![]()
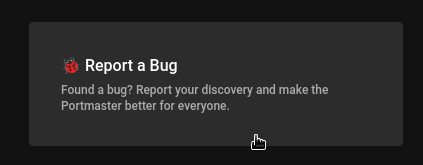
- Then, click on “Report Bug”, and enter the following information:

- Title: “Debug Info for Issue”
- What Happend: Enter the Ticket ID or Github Issue URL.
- Then click on “Send Private Ticket” on the bottom of the page.
- You don’t need to provide an email.
- Notify the thread where you were asked to send the Debug Info that you’ve sent it.
¶ Using cURL
If you’re a Linux user, you might want to get this data directly to your terminal. You can do this with the following command - and maybe pipe it to your clipboard to a file.
curl http://127.0.0.1:817/api/v1/debug/core
¶ Logs
Portmaster writes logs for all components. Logs are written in different levels to reduce sensitive information in logs and keep them in a manageable size. They are also automatically deleted after some time.
You may have been asked to change the Log Level before submitting the logs.
Please always provide the newest .log and .error.log files during which the reported issues occurred.
You can find the log files here:
Default Log File Locations:
-
Windows
- Core Logs:
C:\ProgramData\Safing\Portmaster\logs\core - App Logs:
C:\ProgramData\Safing\Portmaster\logs\app - Notifier Logs:
C:\ProgramData\Safing\Portmaster\logs\notifier - Start Logs:
C:\ProgramData\Safing\Portmaster\logs\start
- Core Logs:
-
Linux
- Core Logs:
/opt/safing/portmaster/logs/core - App Logs:
/opt/safing/portmaster/logs/app - Notifier Logs:
/opt/safing/portmaster/logs/notifier - Start Logs:
/opt/safing/portmaster/logs/start
- Core Logs:
We recommend that you upload these files to your favorite pastebin/privatebin or use our instance and add a 1-3 months expiration.
You can find the documentation of the API endpoints here:
Search terms:
- electron
- troubleshoot